
If you’ve ever wondered whether your SEO efforts are truly paying off, you’re not alone.
In the fast-paced world of digital marketing, guessing just doesn’t cut it—especially when the right analytics can show you exactly what’s working and what’s not.
Whether you’re optimizing a small business site or scaling a content empire, tracking your SEO performance is essential for sustainable growth.
In this guide, I’ll walk you through the key metrics, tools, and expert strategies needed to monitor, interpret, and act on SEO data like a pro. Let’s turn your numbers into insights—and your insights into results.
1. Why SEO Tracking Is Important
With digital marketing, SEO isn’t a “set it and forget it” project—it’s a process. I’ve worked with brands that have gone from bootstrap startups to Fortune 500s as an SEO strategist, and I’ve seen first-hand what can make or break a campaign with regular tracking. Without taking advantage of analytics, you might as well be flying blind.
Monitoring SEO performance is not about keeping an eye on increasing numbers. It’s about observing which activities bring more visibility, traffic, and conversions—and which don’t. It allows you to optimize your approach, concentrate more resources where impact matters most, and waste neither time nor money.
And thanks to today’s technology, all users have access to complete information that accurately represents their online presence. Here’s how they can.
2. SEO Metrics to Prioritize

SEO metrics are your guiding North Star. If you care about website performance, here’s what SEO KPIs you should pay attention to.
- Organic traffic: This type of traffic comes directly from search engines. The bigger number generally indicates better ranks or more targeted traffic.
- Keyword Rankings: Track rank shifts in SERPs with software like Ahrefs or SEMrush. Look for trends over time, not day-by-day fluctuations.
- Click-Through Rate (CTR): Many impressions but low CTR? Red flag. Fix meta titles and descriptions.
- Bounce Rate: Not a metric specific to SEO, though it can, nevertheless, highlight mismatches in search intent versus content.
- Conversion Rate: But traffic, while important, only matters if it then converts. Track sign-ups, form submissions, or purchases.
- Page Load Time: Google does rank by this. Test occasionally with tools such as PageSpeed Insights.
- Core Web Vitals: The newest of Google’s signals to rank, they are LCP, FID, and CLS. Bad values in these can ruin otherwise good pages.
Learn them, though. It’s in knowing how to distinguish between noise and story, then making intelligent choices as to your SEO approach.
3. Leveraging Google Analytics 4 (GA4) for SEO Insights
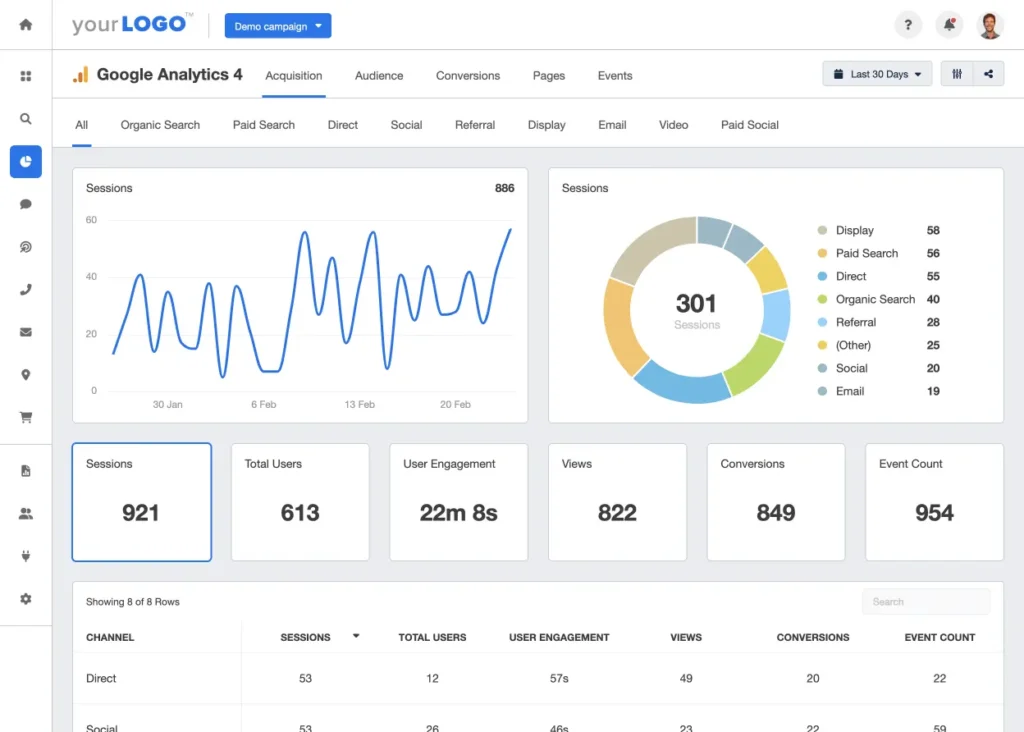
Google Analytics 4 (GA4) revolutionized the way marketers engage with user data. Making the change from Universal Analytics can seem like exploring new unfamiliar terrain, but trust me, it’s worth the effort.
Start by setting up a GA4 property. Once you’ve set up tracking code, go to the Traffic Acquisition report. There, you’ll find which traffic sources produce organic traffic. Volume isn’t everything—also check for engagement metrics like average session duration, as well as engaged sessions per user.
GA4 event tracking allows you to measure engagement in addition to basic pageviews. Track scrolling depth, video viewing, or downloads. If you are tracking form submissions or product clicks as points of conversion, identify them as custom events.
Utilize Exploration Reports to create a funnel or a customized path. Want to find out what individuals tend to do once they reach your SEO site? That’s where you find out. And connect your GA4 property to Google Search Console to import keyword-level details directly to GA4.
GA4 isn’t all about what’s happening at your site. It’s about connecting user behavior to SEO outcomes—information that’s invaluable in optimizing your approach.
4. Leveraging Google Search Console (GSC) for Performance
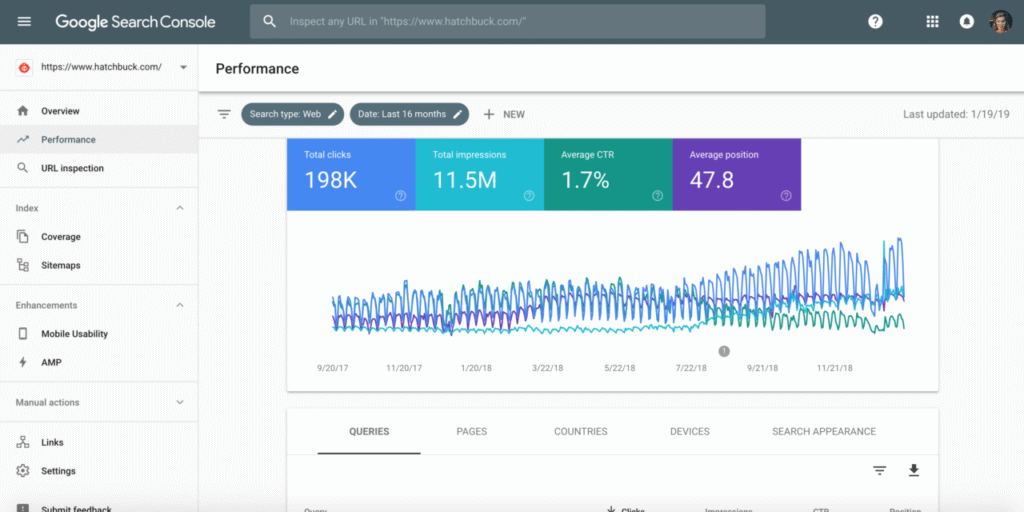
While GA4 tells you what users are doing, GSC tells you how they arrived. It’s your window into Google’s knowledge of your site. I always advise new clients to have GSC set up before taking any SEO action.
Begin with verification. Once done, submit your sitemap so that you can ensure your site’s crawling and indexing. Then proceed to the Performance tab. The tab indicates which searches are getting impressions as well as clicks, along with CTR and average position.
View Pages to see which URLs rank. Compare high-performing pages with low-performing ones to find gaps in content. Use the Countries tab to check your global SEO coverage and make adjustments.
The Coverage report detects crawl errors, unindexed URLs, and server errors. Ignoring it is like driving a car with a check engine light. Repair problems as soon as possible to maintain search presence.
Dig into the Enhancements tab, as well. There’s where you’ll discover mobile usability as well as structured data errors—both key elements of SEO in today’s age. I’ve witnessed companies regaining ranks simply by correcting mobile rendering issues shown in GSC.
GSC stands as your diagnostic tool as a whole. Combine its findings with GA4 behavioral data to conduct a complete SEO analysis.
5. Combining GA4 & GSC for Detailed Analysis
For the most meaningful insights, integration is where it’s at. When you merge GA4 with GSC, you put behavior together with acquisition in a single interface—streamlining your analysis. It’s easier to identify which search terms are bringing in the people, as well as what they are doing once they arrive.
This integration provides you with a better understanding of your content’s performance. For instance, a post ranked for a search term but low engagement in GA4, which indicates that it’s not satisfying user intent. Low impressions with high engagement? It’s time to increase rankings or tackle related terms.
Through integrations, I’ve allowed clients to identify top priority updates for their content and use their resources wisely. It’s a complete game-changer for any serious performance marketer.
6. Advanced SEO Analytics Tools
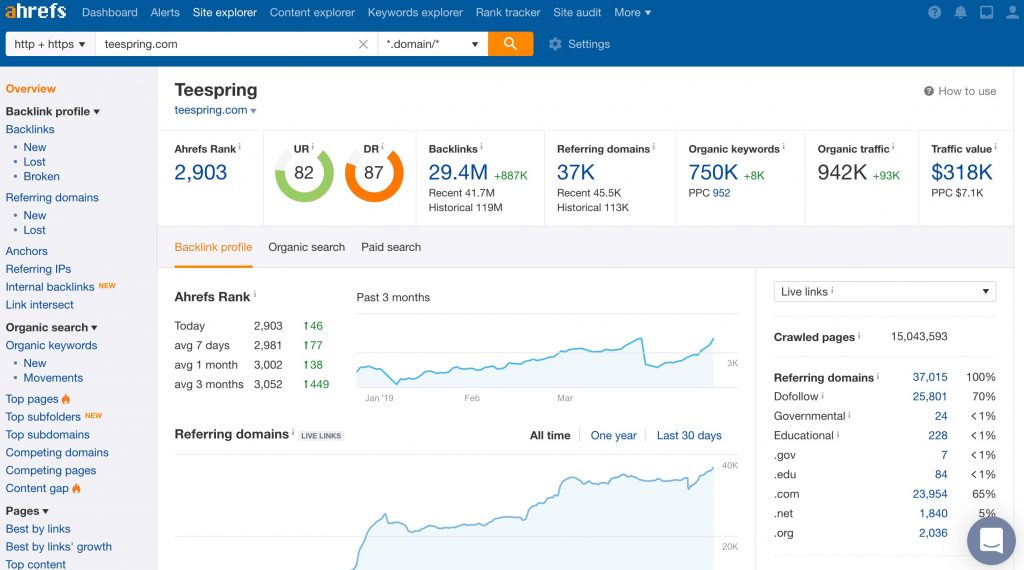
Although both GSC and GA4 are must-haves, more sophisticated SEO analytical tools can drive your approach from good to excellent. With first-hand experience in working with nearly all of the widely recognized SEO platforms, here’s a quick rundown of what’s worth noting:
- SEMrush: Most important tool for competitor comparison, site audits, along with keyword research. Their keyword gap tool itself can reveal goldmines.
- Ahrefs: Famous for backlink monitoring and also content explorer tool. Excellent for finding the best-performing content in a niche.
- Moz: Intuitive user interface with great on-page grader and link analysis capabilities.
- Screaming Frog: A desktop crawler that analyzes your site from a technical perspective. Discover broken links, duplicate content, and redirect problems in no time.
- Matomo: Matomo is a self-hosted version of GA4 with enhanced tracking capabilities if you have privacy concerns.
Every tool has a different strength. I use SEMrush as a strategic planning tool, but I use Screaming Frog to help with a technical site migration audit. One must use the right tool for that task.
Specialized instruments not only complement your data sources, but also help to cross-validate findings in GSC and GA4. Cross-validation generates more informed decisions as well as better SEO outcomes.
7. Creating Custom Dashboards and Reports
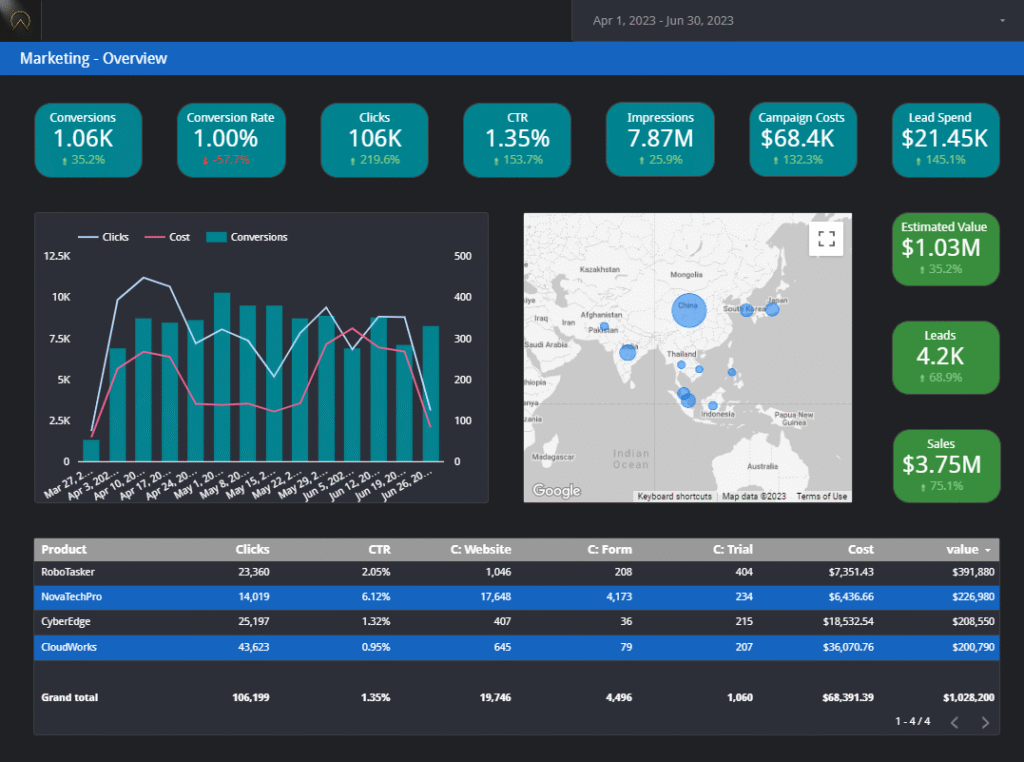
You can only make what you can measure better—and you can only react to information that you can see. That’s why I make custom dashboards standard practice in every campaign I develop.
You can use tools such as Looker Studio (formerly Google Data Studio) to create interactive dashboards that pull from GA4, GSC, and third-party software like SEMrush. This simplifies your information and keeps you from spending hours reporting.
Select KPIs that match your objectives: organic traffic, conversions, bounce rate, and keyword rankings. Apply landing page or device filters to discover detailed trends. Refresh the reports on a weekly or monthly basis, or share with your team or clients.
I was able to reduce a client’s reporting time by 90% by simply implementing a Looker dashboard. It also gave them enough visibility to uncover an indexing issue hidden for weeks.
Dashboards make your SEO data not only available, but also actionable.
8. Steer Clear of These Typical SEO Tracking Mistakes
SEO campaign derailment can come even to the most well-planned efforts. Most prevalent? Neglect in tracking mobile metrics. There’s no room for this deal-breaker in a mobile-first world. Likewise, overreliance on vanity metrics like impressions in absence of tying them to business goals can prove misleading.
The second trap consists of not installing correct conversion tracking. If you don’t, you’ll have no way of knowing if your SEO is driving any revenue. Always make sure events and goals in GA4 have been set up correctly.
Lastly, don’t rely on a single source of information. Use multiple sources to triangulate findings to validate your conclusions.
9. Conclusion and Next Steps
Measuring SEO performance via analytics is an art and a science. When you pair sophisticated platforms with tools like GA4 and GSC, you have a multi-dimensional view of your digital presence.
Use this guide as a starting point to create or improve your tracking system. Start with metrics relevant to your company objectives and make use of bespoke dashboards to ensure versatility. The goal, after all, isn’t more traffic—improved results.
Whether you’re a freelancer with multiple clients or an in-house marketer, knowing SEO analytics can set you apart. Are you set to elevate your tracking? It’s time to make your SEO information work for you.